Research
The President and CEO of the Federal Reserve Bank of San Francisco, one of the twelve Federal Reserve District banks which make up the Federal Reserve System, published a recent paper reviewing the central banks success in relation to its dual mandate. The first part of the mandate is maximum employment and the second is price stability, defined as an inflation rate of two percent.
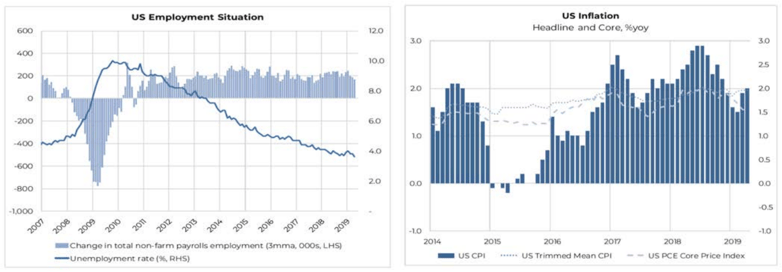
On the second goal of price stability, the Federal Reserve gets a ‘B’. Under Chairmen Ben Bernanke’s stewardship, the Federal Reserve raised the 5-Year, 5-Year Forward Inflation Expectation Rate from 0.5% to 3%. However, inflation expectations have now fallen back below 2%. As the charts above show, this is the inflation puzzle which many economists including ex Fed Chair Janet Yellen called a ‘mystery’.
Why is it a mystery? Because in economic theory a robust economic recovery and a tight labour market, should ignite inflationary pressures. How do we know if the labour market is tight? A tight and inflationary labour market is one in which the unemployment rate is less than the NAIRU (Non-accelerating inflation rate of unemployment), the specific unemployment rate at which inflation stabilises. The Federal Reserve currently estimates a NAIRU of around 4.6%. So, a US unemployment rate of 3.6% is theoretically a tight and inflationary labour market.
Most answers to explain the inflation puzzle have focused on two themes:
1. Independent central banks have been incredibly effective at being credible in anchoring inflation expectations.
2. Structural issues including de-unionisation, increased preference for non-financial employee benefits and weakened worker bargaining power because of automation and globalisation.
There is a lot of merit to both arguments. But both still rely on arguing there is a fundamental breakdown in economic theory and the laws of supply and demand.
I am not prepared to concede these points but instead hypothesise that when it looks like economic theory has broken down and there is a ‘puzzle’, it’s more than likely because the econometric model estimating the data which discovers the ‘puzzle’ is poor and not the theory.
For example, I would argue the calculated current NAIRU should be lower and therefore the reason inflationary pressures have not built up in the US is because the labour market is not in fact tight. During the 2008 Great Financial Crisis it was common for economists to argue the NAIRU should be higher as an explanation to solve the ‘deflation puzzle’ in the US, which hypothesised that if double digit unemployment was in fact full employment this would explain the lack of downward price pressure. My argument is simply the corollary to this argument.
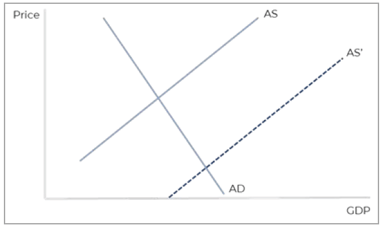
Econometric models used to calculate the hypothetical NAIRU rate are more than likely wrong in both examples. The rightward shift in the aggregate supply curve over the last twenty years, due to advances in technology and the rise of India and China, have probably been severely underestimated. The chart below shows a large shift in the aggregate supply from AS to AS’, resulting in substantially lower inflation. Only time will tell, but if the NAIRU in the US was currently 2% and not 4.6%, then an unemployment rate of 3.6% would not be inflationary and could continue to support adding 200,000 jobs per month.
There was no deflation puzzle in 2008 and there is no inflation puzzle in 2019.